Why use a scanning tool?
There are thousands of stocks listed in the Indian markets on both the NSE and BSE. It is just impossible to go and look at every stock and read about it. So, you will need a scanning tool which allows you to view a subset of stocks based on your own customized scanning criteria. In order to achieve this, there are many such tools available.
One such scanning tool that I found very easy to use is chartink.com. This is available in both free and premium versions. The free version should be good enough for us. I use it primarily for scanning based on technical conditions. However, you can also find a few fundamental parameters that you can set. For purely fundamental screening, I found screener.in to be the best and you can find more information on how to get started with it in my blogpost.
How to use chartink.com?
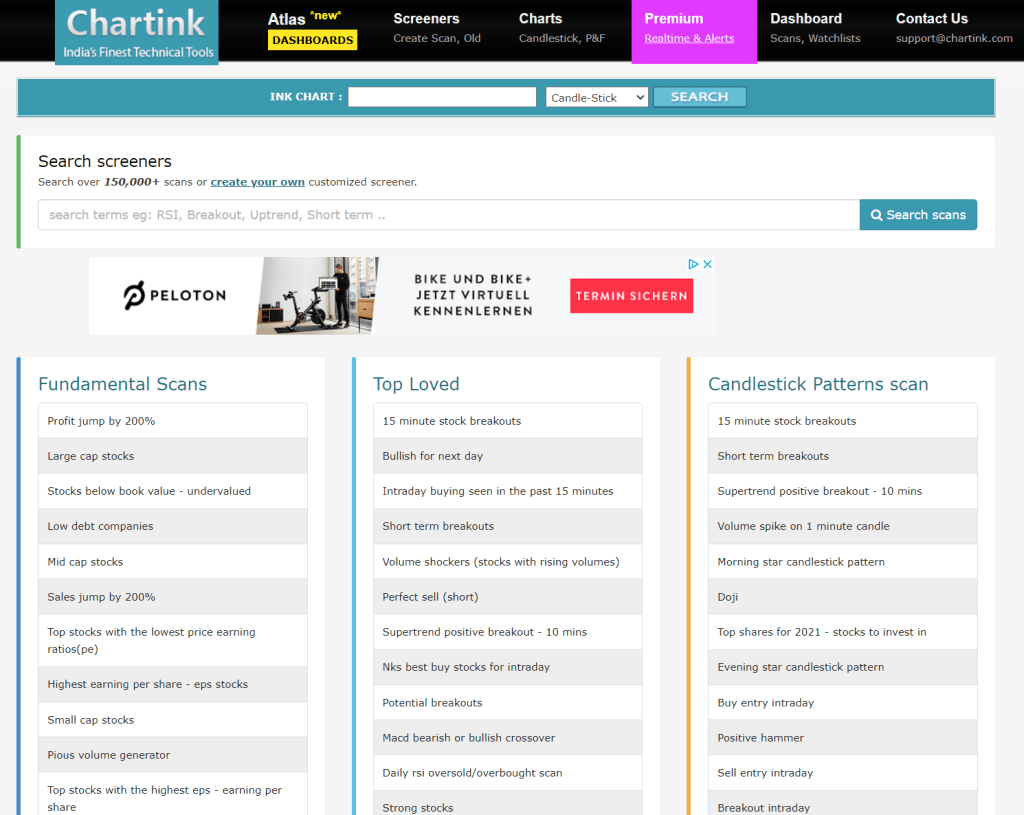
When you open the website you will see the home page as shown below. In the menu items, click on Login/Register and register yourself.

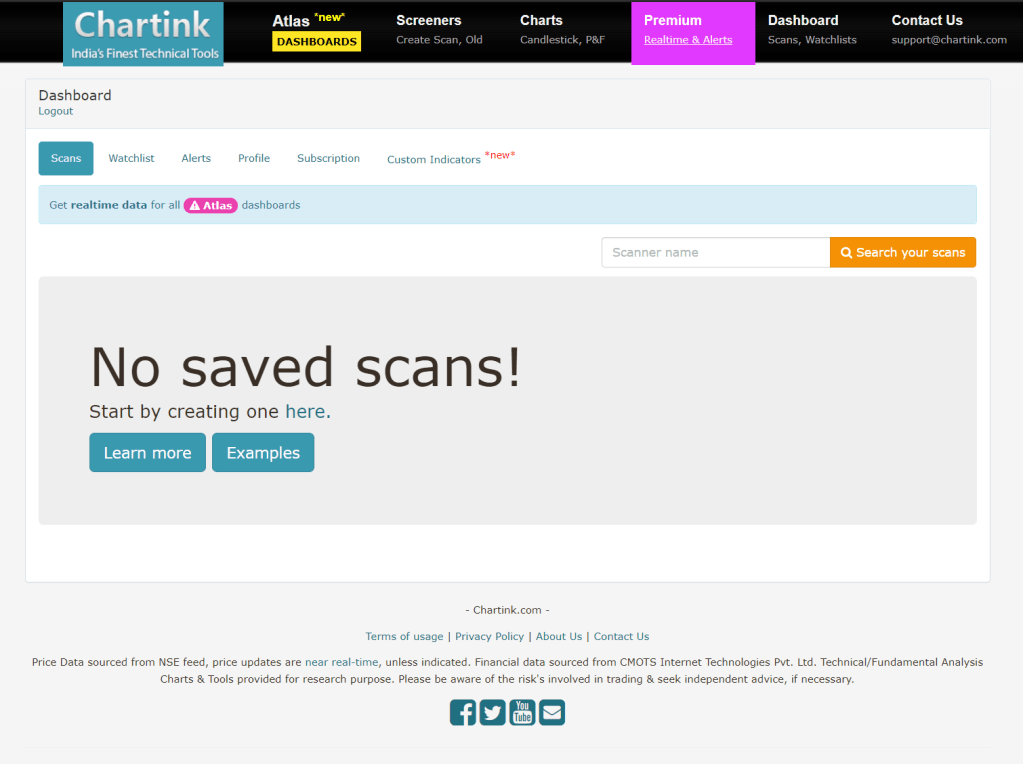
Once you register, click on the Dashboard in the menu items and you will see a page as shown below. This is going to be the most important page for us. You can create your scans here. Let’s create one so that you can get familiar with it. Click on ‘here’ in the text ‘Start by creating one here’.
You should now see a page as shown below. Let’s try to create a scan for stocks crossing 200 day moving average. Your condition will be closing price should have crossed above 200 day moving average. In terms of logic it will be “close crossed above 200 dma”.
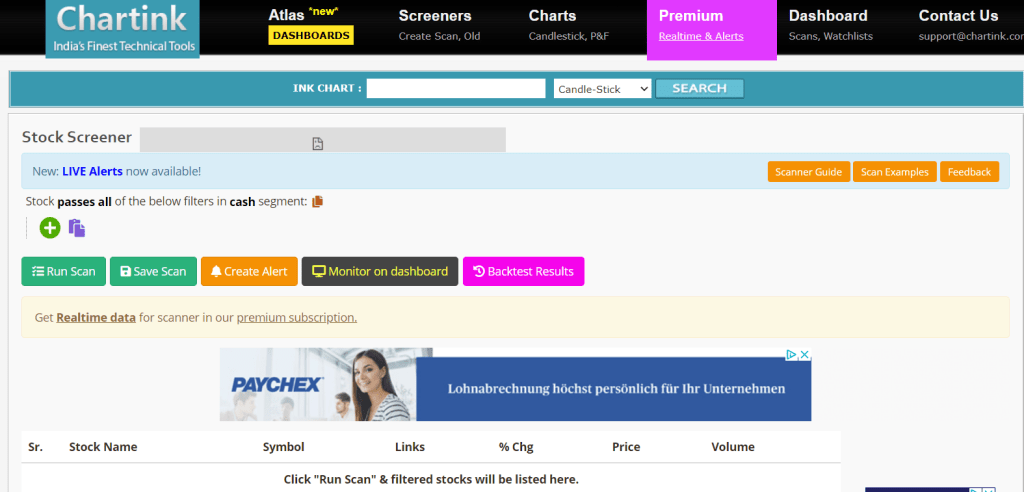
Click on + symbol as you see in the above image and you should see a dropdown with a section called “stock attributes” and in that select “Close”. You will see a the scanning criteria created as shown in the below image. Now click on the symbol next to close.
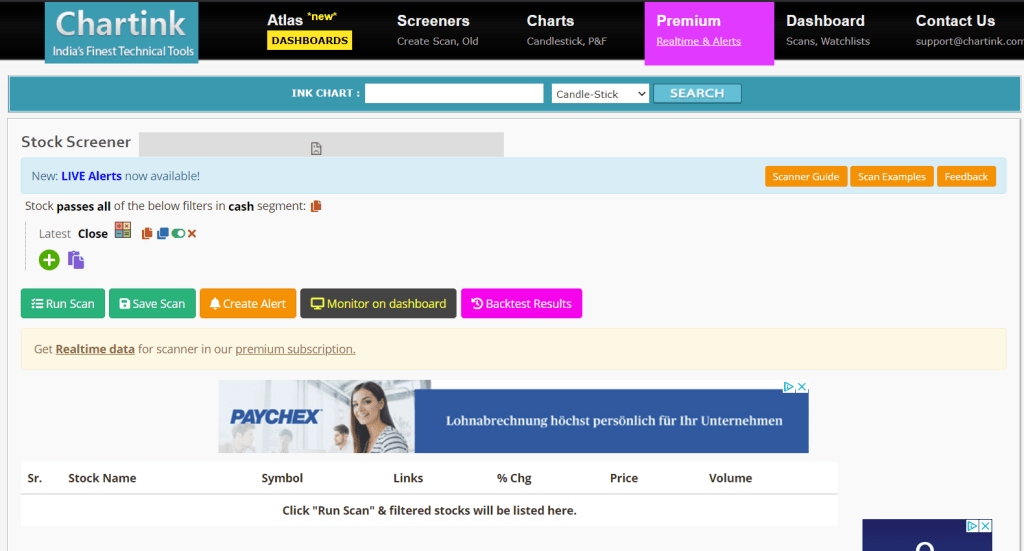
You should see another dropdown with operations. In this go to “Cross operations” section and select “crossed above”. Now, you should see something as shown below. We are almost there…
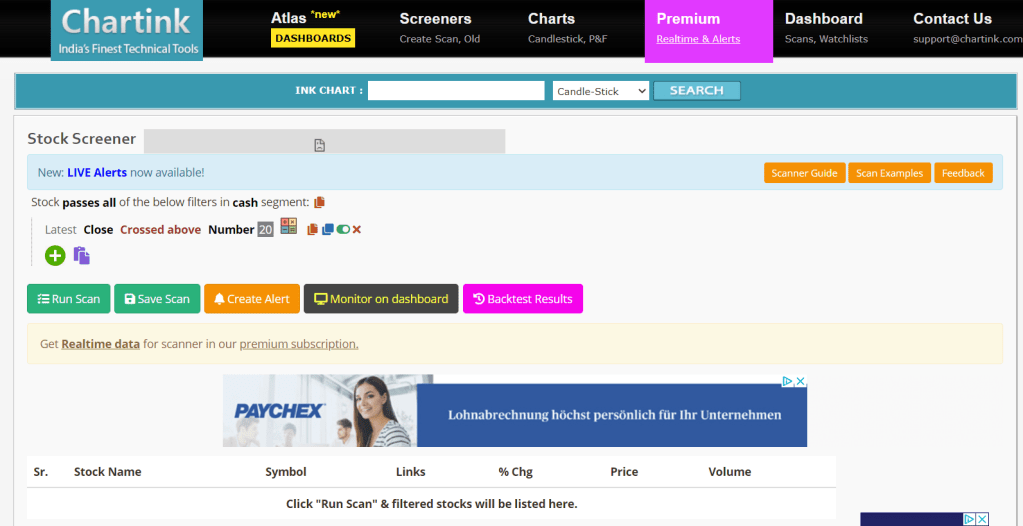
Next, click on the text “Number(20)” and you should see another dropdown with a section called “Indicators”. Select “Sma(simple)” here and you should see a line as shown below.

Next, click on the the number “20” and change it to “200” and you have your first simple scanner ready to use.

Click on ‘Run Scan’ button and you will see a list of stocks. The results should show all stocks that have crossed 200 daily moving average today. You can also save this scan for future use by clicking on ‘Save Scan’ button and giving the scan a name.
Here Latest in the criteria means the daily timeframe. If you want to chain it to any other timeframe, click on “Latest” and you should see a dropdown with all other timeframes like weekly, monthly etc.

The best thing about chartink is the public screeners made available to everyone. You can even create a scanner, give it a meaningful name and post is for public use. There are thousands of such public scanners available in the Screeners section. Click on Screeners in the menu item and you will see something as shown in the below image.
Now go explore and find the scanner you would want to use day in and out!
If you liked my blog, you can support me by buying me a coffee!

Thanks for sharing this da ! Looks good !
LikeLike