In this week’s blogpost, I will be writing about another simple pattern that can be easily identified and which can reward you handsomely in the short and long term depending on the duration of the pattern.
The ascending triangle pattern would reward well in a strongly trending stock.
How to spot an Ascending Triangle pattern?
The rules are very simple – the pattern needs to have a horizontal top line and an upward sloping trendline that forms the ascending triangle pattern. Many a times, a breakout from this patterns leads to a strong rise in price.
In the below example of MCX (daily chart), you can notice the ascending triangle pattern. Remember, the price should at least touch the upward sloping trendline 2 times. Anything more than 2 touch points is a strong setup.
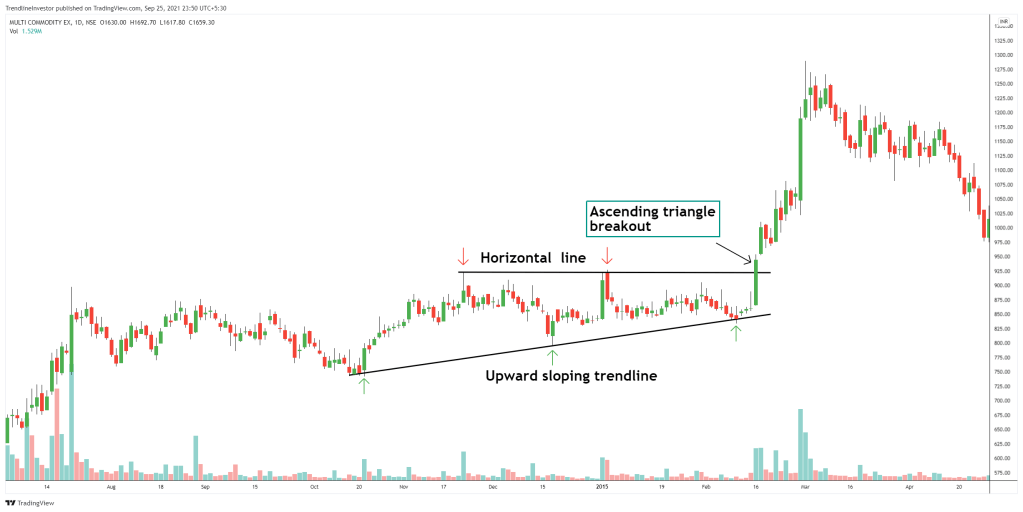
The horizontal line acts as a zone of price rejection from where the price reversed two times. The upward sloping trendline acts as a zone of price support from the where the price reverses every time and goes up.
Once the price crosses the horizontal line, there is a sharp rise in price which brings in good volumes which is highlighted below in the chart.
How should you trade the ascending triangle pattern?
In order to trade this pattern, you should
- Identify the horizontal line from where the price reversed at least twice. This level need not be perfect.
- Identify the upward sloping trendline which has at least two touch points where the price reversed.
- Buy the stock once it crosses the upper boundary. You can place a buy-stop order and when the price crosses the upper boundary the order would be triggered.
- Keep a stop loss below the previous swing low.
Remember longer the duration of this pattern, the stronger the price move up.
Let’s take a few more examples of this pattern
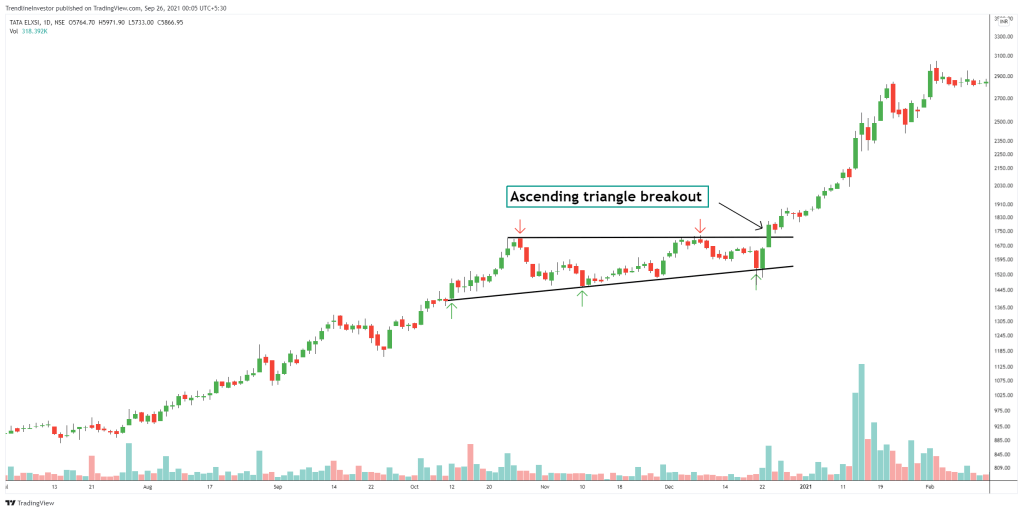
Example 1: Tata Elxsi
Below is an example of TataElxsi. The price was trending in an ascending triangle pattern for more than 2 months and then had a strong breakout which took the stock to much higher levels from the breakout zone.
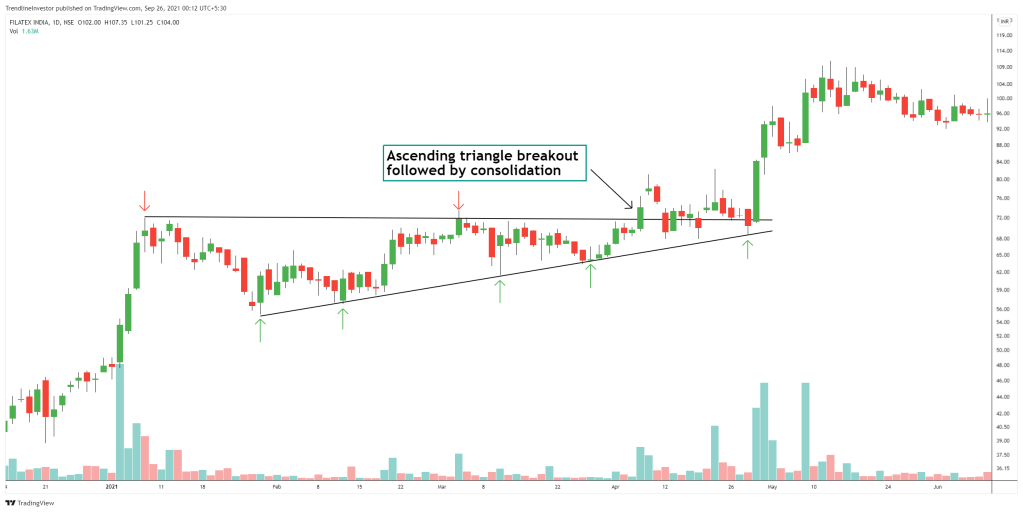
Example 2: Filatex
Below is another example of Filatex where the price was forming an ascending triangle pattern for 3 months. In this case after the breakout the stock went sideways and retested the lower end of the ascending triangle following which the stock rallied again.
I hope this explanation has been useful and you will be able to find and trade the ascending triangle pattern successfully.
If you liked my blog, you can support me by buying me a coffee!

Great information !!!!!! Great charts !!
LikeLike