In this week’s blogpost, I will be writing about a pattern that if identified correctly, can give good returns in the short term. This pattern is similar to the letter ‘W’ and forms at the end of a downtrend and can signal the start of a new trend.
How to spot a Double Bottom pattern?
As I mentioned already, keep the the letter ‘W’ in mind and try to spot a similar pattern in a stock price after a strong downtrend. The below conditions need to be met:
- The pattern needs to have a prior strong downtrend
- After forming a low, the price reverses and moves up to form the 1st bottom
- The price then again drops and reaches the 1st bottom low but ideally does not go below that bottom forming the 2nd bottom
- However, only the 1st and 2nd bottom is not enough- the price now needs to cross the resistance line or the ‘W’ pattern to confirm a successful double bottom pattern
In short, the 1st bottom along with the 2nd bottom after a prior downtrend and a breakout from the resistance line or the ‘W’ pattern, forms the double bottom pattern. What follows this breakout is ideally a strong uptrend.

In the above example of Adani ports you can observe the Double Bottom pattern on the weekly charts in 2016 and how a breakout lead to a strong rise in the price.
How should you trade the Double Bottom pattern?
In order to trade this pattern, you should:
- Identify a prior downtrend
- Identify the 1st bottom
- Identify the 2nd bottom
- Identify the resistance line
- Buy the stock once it crosses the resistance line – You can place a buy-stop order and when the price crosses the horizontal neckline the order would be triggered
- Keep a stop loss below the previous swing low
Let’s take a few more examples of this pattern
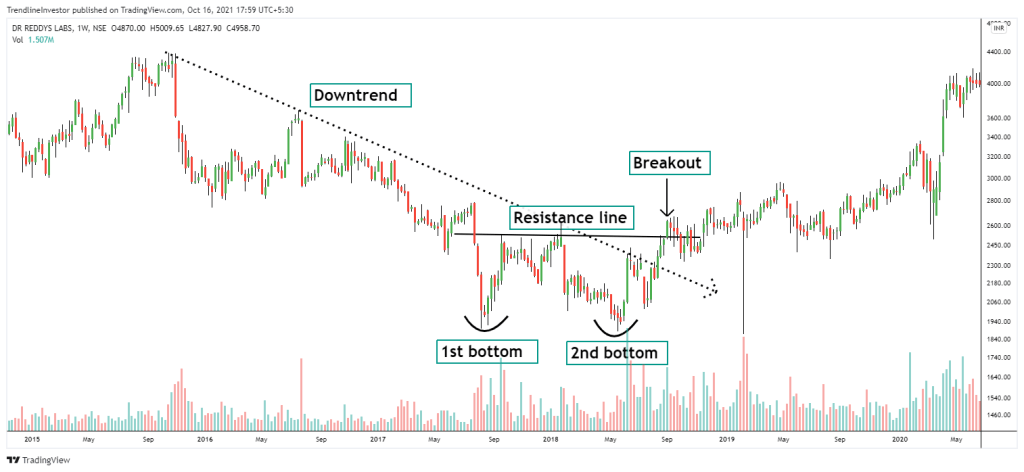
Example 1: Dr Reddys Labs
Below is an example of Dr Reddys on the weekly chart when it formed the double bottom pattern in 2017-2018. The price dropped to form the 1st bottom in Aug’17, reversed to form the resistance line and then again dropped towards the 1st bottom low in May’18 and subsequently broke the resistance line in Sep’18 thus forming a successful double bottom in the stock. The stock has almost doubled since then.
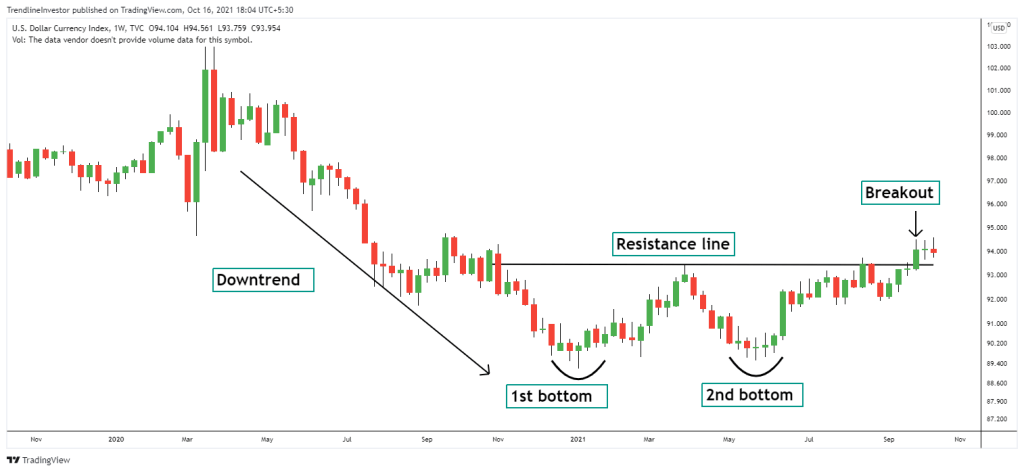
Example 2: Dollar currency index (DXY)
Below is another example of DXY where a double bottom pattern formed recently and the price is above the resistance line. As of today the Dollar does look like it has made a bottom. Whether it will move up from here or go back down is a question only time can answer.
I hope this explanation has been useful and you will be able to find and trade the Double Bottom pattern successfully.
If you liked my blog, you can support me by buying me a coffee!
