Understanding Candlesticks
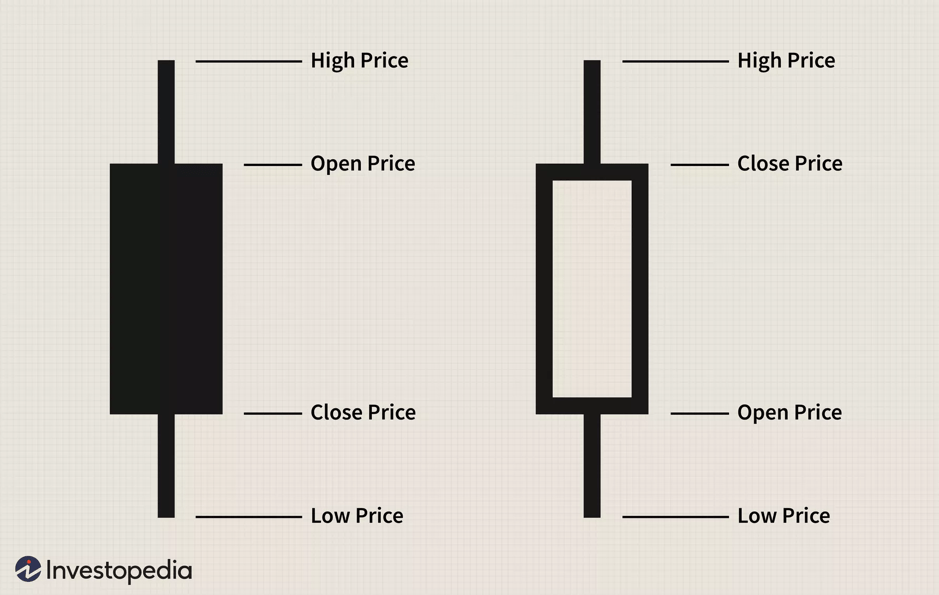
The below image is from Investopedia which I will refer to, in order to explain candlesticks.
A Black/Red candle signifies that the price moved down, during a specific time period.
A White/Green candle signifies that the price moved up, during a specific time period.
What is the significance of a Candlestick?
Let’s take the example of a vegetable seller in the market. The seller opens shop in the morning and is awaiting his first customer. The seller has a certain price in his mind- which is based on various costs he has incurred and the profit he is expecting to make. Let’s assume the cost price is 5. Depending on this, when the first buyer asks for the price, he will give a quote. If the buyer agrees to his price, then he sells. Let’s say this price is 10. This becomes the open price.
Let’s say during the day, there was lot of demand and the seller got to sell his vegetables at a maximum price of 15. This becomes the high price.
Let’s say at 4 PM, an hour before he shuts shop, the seller has lots of vegetable left and he sees a big buyer who wants to purchase 50% of his left over stock and the seller decides to drop his price to 9. This becomes the low price.
Let’s says the last vegetable he sold at 6 PM before he left was at 12. This becomes the close price.
The markets work in a similar way, and we have four different prices which becomes an important indicator about the stock sentiment and this is referred to as OHLC (Open, High, Low and Close).
In this case a green/white candle is formed because the opening price was 10 and closing price was 12. So, the vegetable seller had a good day.
Had it been the other way around, the open price was 12 and closing price was 10, the vegetable seller might have a relatively bad day and the candle if drawn would have been red/black.
Now, depending on how the open, high, low and close prices are formed the candle patterns vary and I will explain the significance below.
Understanding stock sentiment through candle OHLC in 3 scenarios
Scenario 1: Buyers overpowering sellers
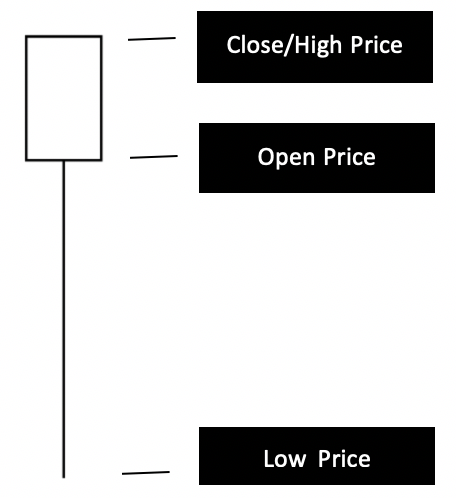
White/Green candle with Open=Low and Close=High
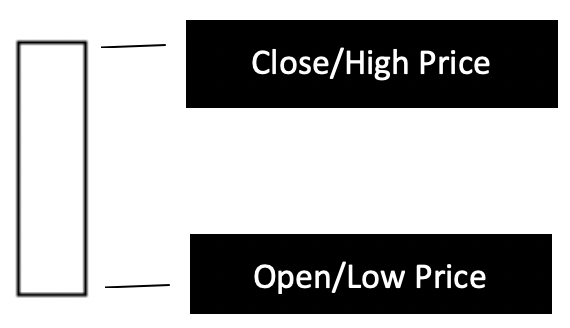
Let’s say, the vegetable seller here sold his vegetables to his first customer at a price of 10. After some time, let’s presume this customer tells his relatives that this seller sells good quality vegetables at a price of 10. Now, when they come to the seller, the seller seeing the increasing demand, decides to increases the price continuously every few hours and his stock still keeps selling because of good demand, due to word of mouth marketing. The reason for increasing demand could be anything! The point here is that the seller has the right product and he is able to sell it at a higher price continuously.
Now, there might be a few times during the day where his selling price drops a bit. But again, the seller is able to sell at a higher price continuously and his last sale was at the highest price. This shows that his product had good demand and he might expect the same trend to continue the next day as well. What happened here is that the seller had a really good day selling his vegetables.
In stock markets, buyers overpowered sellers and created good demand for the stock. Such candles are a delight for stock buyers because of the continuous price rise!
Scenario 2: Sellers overpowering buyers
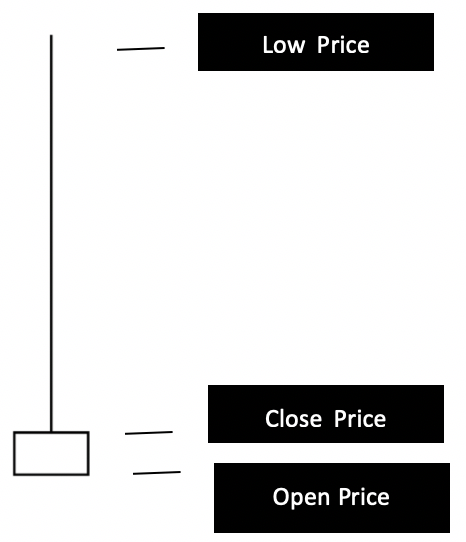
Black/ Red candle with Open=High and Close=Low
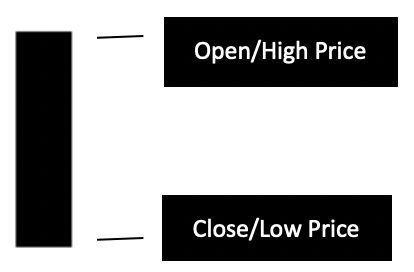
The above candle is the exact opposite. Let’s assume the seller opened his shop and has vegetables which are not fresh. The seller knows that if he doesn’t sell it today, he might have to throw it out tomorrow. Given this situation, let’s say he was optimistic of his sales and he sold his stock to the first customer at a price of 10. But the next customer who knows the state of the vegetables complains and get a good bargain at a price of 8.
Now, the seller gets cautious and decides to drop the price to 9 for the next customer. But the next customer looks at the quality of the vegetables and walks away. This makes the seller more cautious and decides to drop the price further to 8, for the next customer. Now, his best lot of vegetables has been sold and he is left with the remaining lot which is at an even worse state. The next customer comes now with a big demand and the seller believes that this is the right time to sell his stock and agrees to sell it at a rate of 5 and sells 80% of his remaining stock. Now, the seller is happy that he at least recovered his cost (as we have assumed the seller’s cost price was 5) and sells the remaining stock at 5 and goes home happily.
What has happened here is the seller just got rid of his stock which he bought at a good price to start with at a 100% profit (Cost=Rs 5, first sell price=Rs. 10). But, later knowing the demand wasn’t as good, got rid of the entire stock at cost and went home with little profit. In many cases, this can be loss as well if the numbers are tweaked accordingly.
Translating this to a market context, this means that the sellers wanted to get rid of their stock and could not find buyers at higher levels and hence had to sell at lower prices. Any such candles on any time period in the market is not a pretty sight for stock buyers!
Scenario 3: Indecision
Example 1:
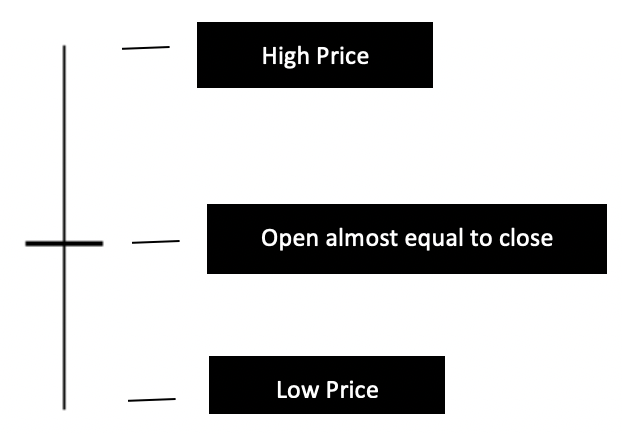
This candle is pretty interesting! Now, given the above examples and explanations this should be pretty easy to understand. The seller had a pretty dramatic day! His first set of vegetables sold at 10, during the day he has sales at 15 (high price) and also 5 (low price) and finally sold his last set of vegetables at 9.
What does this mean? The buyers of the vegetables had a good bargain when the price was at 10, the seller also had a good bargain when the price was 15 and some buyers got a reasonable price compared to the high prices.
In stock markets, this shows that neither buyers nor sellers were strong enough to overpower one another.
Example 2:
This candle shows that the seller started selling at 10 and he had to reduce the price all the way to 5 during the day. But at the fag end of the day or later part of the day, the seller sold his vegetables at 15.
In stock markets, this shows when the price went low after open, there was a good demand for the stock and price. This candle is a good sign for the stock.
Example 3:
This candle shows that the seller started selling at 10 and he had a good day selling at a very good price, higher than the first deal. But then, suddenly the demand fell drastically and he sold his last set of stock slightly higher than the first deal.
In stock markets, this shows when the price went high after open, there was a good supply for the stock and price due to which the price came down quickly. This candle is a bad sign for the stock.
Key Takeaways
Depending on how the candle forms, we can derive many such conclusions. But, what is most important is how to make a decision.
One cannot take a decision with just one candle. You need to consider the prior candles to deduce what the current candle is inferring.
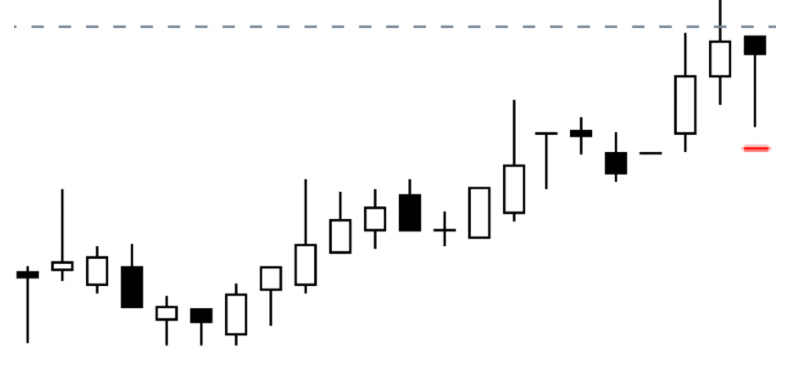
For example, in the below chart the candle to right if considered individually can be considered good because of the reversal from the lower levels. However, when looked at it with the previous candles can suggest that the buyers are losing strength because of the strong dip below, when the sellers came in and took the price lower before the price reversed. This candle also can signal that buyers had control during the day.
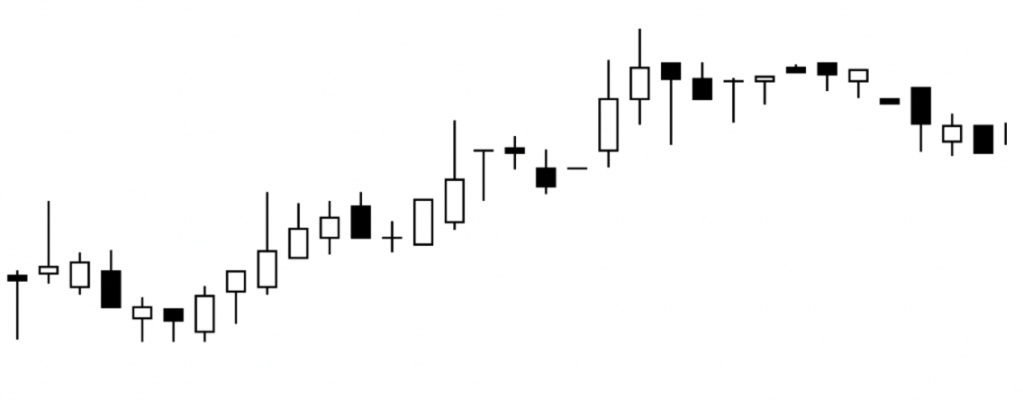
What happened after that? The price started consolidating and started dipping lower. Refer to the chart below.
Hope these examples have helped you understand the significance of candlesticks through demand and supply.
For more information, you can refer to https://en.wikipedia.org/wiki/Candlestick_pattern or https://school.stockcharts.com/doku.php?id=chart_analysis:candlestick_pattern_dictionary
Let me know if you have any questions in the comments section.
If you liked my blog, you can support me by buying me a coffee!

Well articulated !!
LikeLike