In this week’s blogpost, I will be writing about another reliable and simple pattern which is the Cup and Handle pattern. This pattern is easy to identify and trade.
This pattern works well in a stock that has been already in a strong uptrend and a breakout from this pattern can give decent if not excellent returns.
How to spot a Cup and Handle pattern?
Just like the other patterns, the rules are again pretty simple here. The cup usually forms when the stock price drops fast to a low point after a strong rise for a few weeks due to aggressive profit booking. The stock price then rises again aggressively over the next many weeks to the previous highs forming the CUP of the cup and handle pattern.
However, near the previous highs of the cup, traders again book profits due to which the stock price drops again but not as deep as before and goes sideways for few weeks forming the HANDLE of the cup and handle pattern.
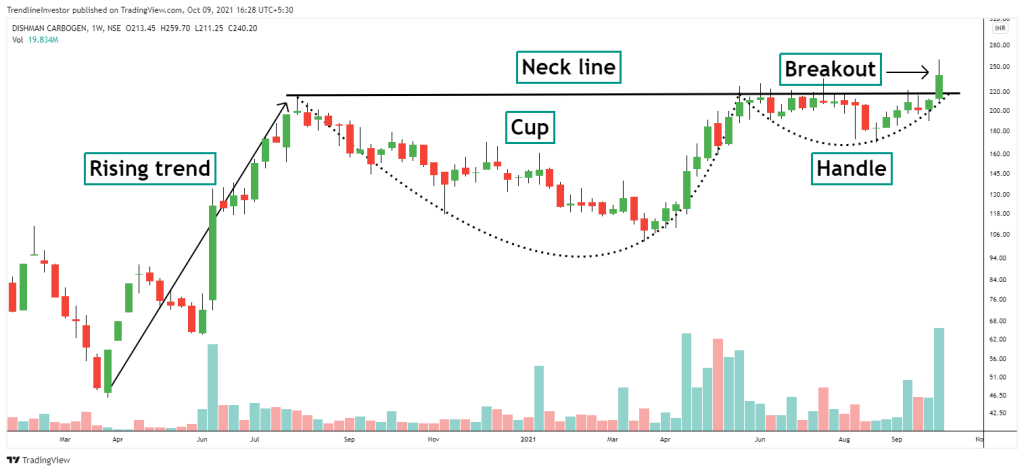
The pattern needs to have a horizontal neckline with price of the cup and handle at similar levels which defines the neckline/resistance of the cup and handle pattern.
A breakout from this pattern would mean the stock moves above the neckline with volumes to continue the trend up. Such breakouts tend to give decent returns in the short/medium term.
In the above example of Dishman Carbogen, you can observe the cup and handle formation breakout that has occurred this week (8th Oct’21).
How should you trade the Cup and Handle pattern?
In order to trade this pattern, you should
- Identify the horizontal neckline where the price is facing resistance and is unable to cross higher
- Identify the cup – the price should have dropped aggressively and again risen to the previous high point
- Identify the handle – the price should have dropped from the cup level again but not too deep as the cup
- Buy the stock once it crosses the horizontal neckline- You can place a buy-stop order and when the price crosses the horizontal neckline the order would be triggered
- Keep a stop loss below the previous swing low.
Remember, the longer the duration of this pattern, the stronger the price move up.
Let’s take a few more examples of this pattern
Example 1: Nifty
Below is an example of Nifty on the hourly chart. The price dropped really quickly before stalling and consolidating for a few hours and again rose to the previous high point forming the cup. The price after retesting previous high again dropped but not as strong as before, thus forming the handle. The next day Nifty gapped up above the horizontal neckline and rallied strong.

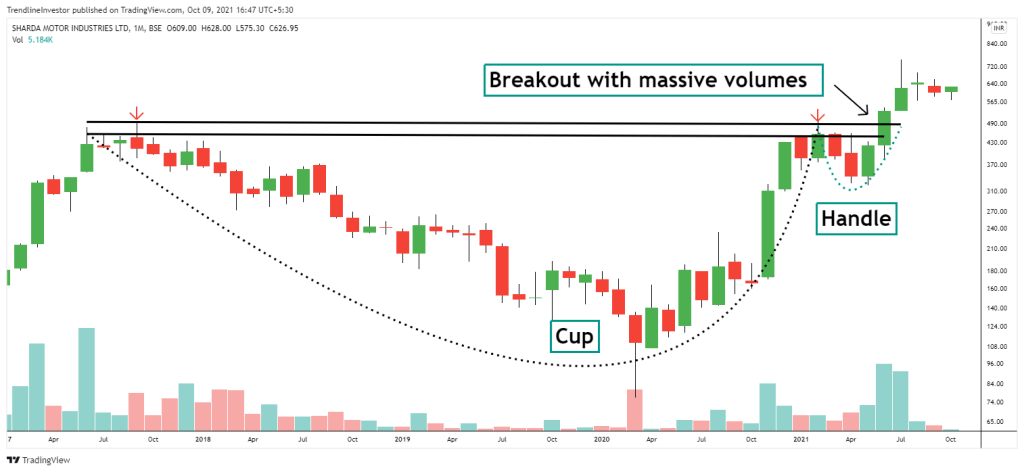
Example 2: Sharda Motor Industries
Below is another recent example of Sharda Motors where the cup and handle pattern formed over 4 long years.
I hope this explanation has been useful and you will be able to find and trade the cup and handle pattern successfully.
If you liked my blog, you can support me by buying me a coffee!
