On the occasion of the 10th edition of the Weekly Newsletter, I thought of sharing a simple yet effective investment strategy that you can follow for investing.
Here are the tools and indicators that we will use for this investment strategy.
Commodity Channel Index (CCI) Indicator
This is an indicator that displays the momentum of a stock price. Momentum is nothing but the pace at which the stock price is going up or down.
So, if a stock is going up more than the recent average and the momentum on the upside is strong, this indicator will display a value above 100+. Alternatively, if a stock is going down more than the recent average and the momentum on the downside is strong, this indicator will display a value below -100.
Go to Tradingview.com and select any stock. In Indicators section, search for ‘Commodity channel index’ to add this built-in indicator. Now, change the Length from 20 to 34 in the indicator settings. If you are new to Trading view, refer to this blogpost to learn how to use it.
Pivots Indicator
This indicator identifies the key price points above/below which the price can display a strong move.
Go to Tradingview.com and select any stock. In Indicators section, search for ‘Pivot Points High low’ to spot this indicator.
How to get started with investing in a stock?
In order to invest in a stock we need to know the following:
- How to filter stocks?
- Which stock to select?
- When to invest?
- How much to invest?
- When to add more?
- When to exit?
Let’s look at each of these in detail.
How to filter stocks?
There are thousands of stocks in the Indian market and it is just not possible to invest in all of them. But then how do you know which is the possible set of the stocks that you can look at?
To do that you need a scanner. As I mentioned in one of my previous blogpost, Chartink.com is the scanning software that I use and you can use this scanner: CCI(34) Weekly crossing 100 which I have already setup for you.
What does this scanner do? It has a set of filters and will display stocks that satisfy the following conditions:
- CCI value crossing 100
- Market capitalization (no. of shares multiplied by stock price) only greater than 500 cr
- Stock price greater than Rs.10
- No. of stocks traded should be greater than 50000
Which stock to select from this list?
Take the list of stocks from the chartink scanner results, go to screener.in and search for the stock name. If you do not know how to use screener.in, you can refer to this blogpost.
I have taken the example of Indiamart and highlighted the key ratios that need to be analysed.
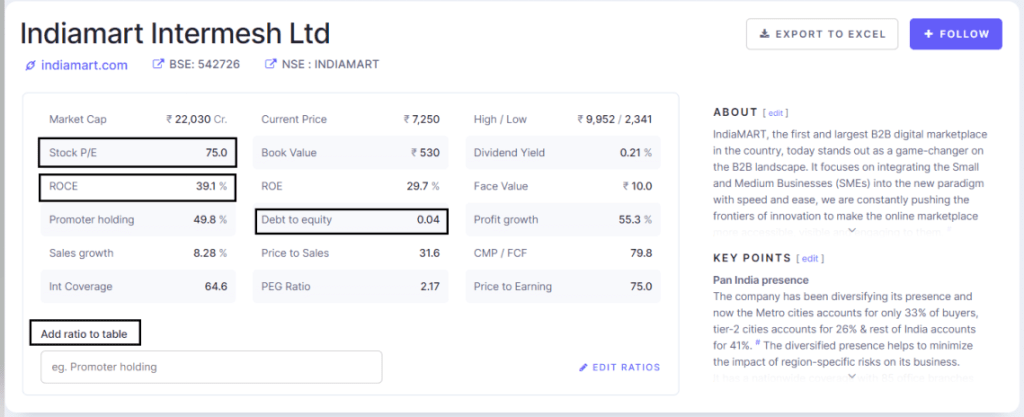
In Screener.in, check the ROCE (return on capital employed) of the stock. This number should be above 10. If the value is below 10, it is safe to ignore the stock and move on to the next stock.
Next, check the ratio of Stock P/E to ROCE. This should be less than 2, if it is greater than 2 ignore the stock and move on to the next one. Basically, we are checking that the stock should not be overvalued. So, if the stock P/E is 75 (which is very high in normal terms), then the ROCE of the stock also should be high if we want to consider this stock.
Next, check the Debt to Equity ratio. This should be only below 1. Basically, we are looking for stocks that are not debt ridden with this filter criteria.
When to invest?
From the above shortlist of stocks, you only need to select the stocks that have a consistent increase in sales and profits over the years. You can see the sales and profit trend in the ‘Profit & Loss’ section in screener.in.
After you select the stock, go to Tradingview.com and search for the stock. The CCI indicator for the stock will be above 100 since the chartink.com scanner filters only such stocks.
Next, identify the previous pivot high for the stock. In the below case of Shakti pumps, the previous pivot high was 174.9. Only buy the stock above this high. For our example of Shakti pumps, buy only at 175 (round off the number). If the stock is below 175, do not buy it.
Once you buy Shakti pumps at 175, keep your stop loss for this stock at 95.15 which is the pivot low.

How much to invest?
Invest only 5% of your capital in the stock. If you have 1 lakh for investing, invest only Rs. 5000 in one stock and do not invest in more than 20 stocks. This will ensure the portfolio is not too diversified. Remember, more the stocks, lesser the probability of higher returns. So, try to stick to 20 stocks.
When to add more?
After investing the initial 5% of the capital in a stock, wait for a new pivot high to be formed. In the case of Shakti pumps, the first pivot high was 174.9 and we invested the first time at 175 (5% of the capital). After investing, the stock went up to 184 and then went down all the way to 104.1. So now, 184 is the new pivot high that needs to be crossed.
So, once the new pivot high (184) is crossed we add another 2.5% of our capital at 185 and revise our stop loss from 95.15 to 104.1. We will allocate only 7.5%(5% the 1st time and 2.5% the 2nd time) of our capital in one stock maximum.
Whenever the lower pivot moves higher, we need to revise our stop loss higher also, as mentioned in the chart below.

When to exit?
Whenever the price goes below the previous pivot low, one MUST exit the stock no matter what and find the next opportunity and move on. So, in the case of Shakti pumps the pivot low was at 95.15 which moved higher to 104.1 and then to 405. Later after a few months the stock price went below 405 which was the price point at which we exit the stock and move to the next stock.

Pros of this strategy
- Peaceful method to invest if you have a full-time job.
- Easy to implement if you put in a little effort to understand.
- The investment strategy is on the weekly timeframe and the fundamental filters conditions mentioned will only filter quality companies. So, the chances of getting multifold returns is very high using this strategy.
- Automatic exits when the stock starts a new downtrend. So, the chance of you losing a major part of capital is very less. Even if the stock goes down 50% you will only lose 2.5% of your capital. So, if you have 1 lakh you will only lose Rs. 2500 of your capital.
Cons of this strategy
- Not a get rich quick strategy.
- Need patience and discipline when the stock is going down after gaining very well. Remember, we are looking for multi-baggers – so, you will have to experience some decent moves down for some great moves up. In our example of Shakti pumps we exited the stock at 405. However, do note the stock hit 789.9 before we exited at 405. So, you might give back some returns before you exit.
This strategy can also be applied on the Monthly timeframe and daily timeframe, but I’m going to leave that to you to figure it out.
Hope you found this simple strategy useful and I am sure it will definitely help you. Do let me know if you have any questions in the comments.
Enjoying the blog? Do share it with your friends and family or buy me a coffee!

Very useful content. Thanks for the post 🙂 will try to follow while trading
LikeLike
Very useful startegy
LikeLike
Sir this is very useful. I just wanted to know in daily time frame what would the settings to be done in CCI, Is it same 34. Please confirm
LikeLike