In this blogpost, I will be covering a very important and a reliable pattern formation that can help you in identifying stock reversals or stock bottoms. This is also my most favourite pattern. It has helped me identify some really good stocks specially after the Mar’20 crash.
This chart pattern occurs when the stock is in a strong downtrend and usually signals that a major reversal might occur. However, you might also find this pattern forming after an uptrend – although this is quite rare.
How to spot an inverted head and shoulders pattern?
This pattern forms when:
- The price in a strong downtrend and falls continuously and forms a low first and then rises – creating the Left Shoulder.
- Later the price falls below the left shoulder low and drops fast due to the panic in the market. However, after making a new low the price reverses strongly after the panic bottom towards the previous Left Shoulder top – creating the Head.
- After the prices reaches the left shoulder top, the price drops again due to the selling pressure but the selling stops way above the low of the head or similar to the lows of the right shoulder- creating the Right Shoulder.
- Usually, the Left shoulder and the Right shoulder tops will be at a similar price – creating the Neckline.
This forms the Inverted Head and Shoulder pattern. Once the price breaks above the neckline, one can confirm that a major bottom is in place for the stock. Refer to the below Nifty chart from 2016 for an inverted Head and Shoulders reversal.

How should you trade the inverted head and shoulders pattern?
In order to trade this pattern, you need to:
- Identify the neckline of the pattern
- Buy the stock once the price crosses above the neckline
- Keep a stop loss below the previous swing low
Let’s look at some more examples of this pattern
Example 1: Neuland labs
Below is an Inverted Head and Should pattern formation on the Neuland labs price chart from Nov’19 to Jun’20.
Observe how the pattern formed at the end of the strong downtrend and how the price rallied after the breakout. The price breakout occurred around 492 and the stock price touched an all-time high of 2800.
Long term chart:

Zooming in on the same chart:

In this case, you could have bought the stock above 492 which was the neckline and kept a stop loss at around 387 which was the swing low.
Example 2: WABAG

The WABAG chart also showcases how the stock made a bottom with an Inverted Head and Shoulders pattern. The stock broke out from this pattern around 232 levels and is in a strong uptrend. The stop should have been the previous swing low around 180.
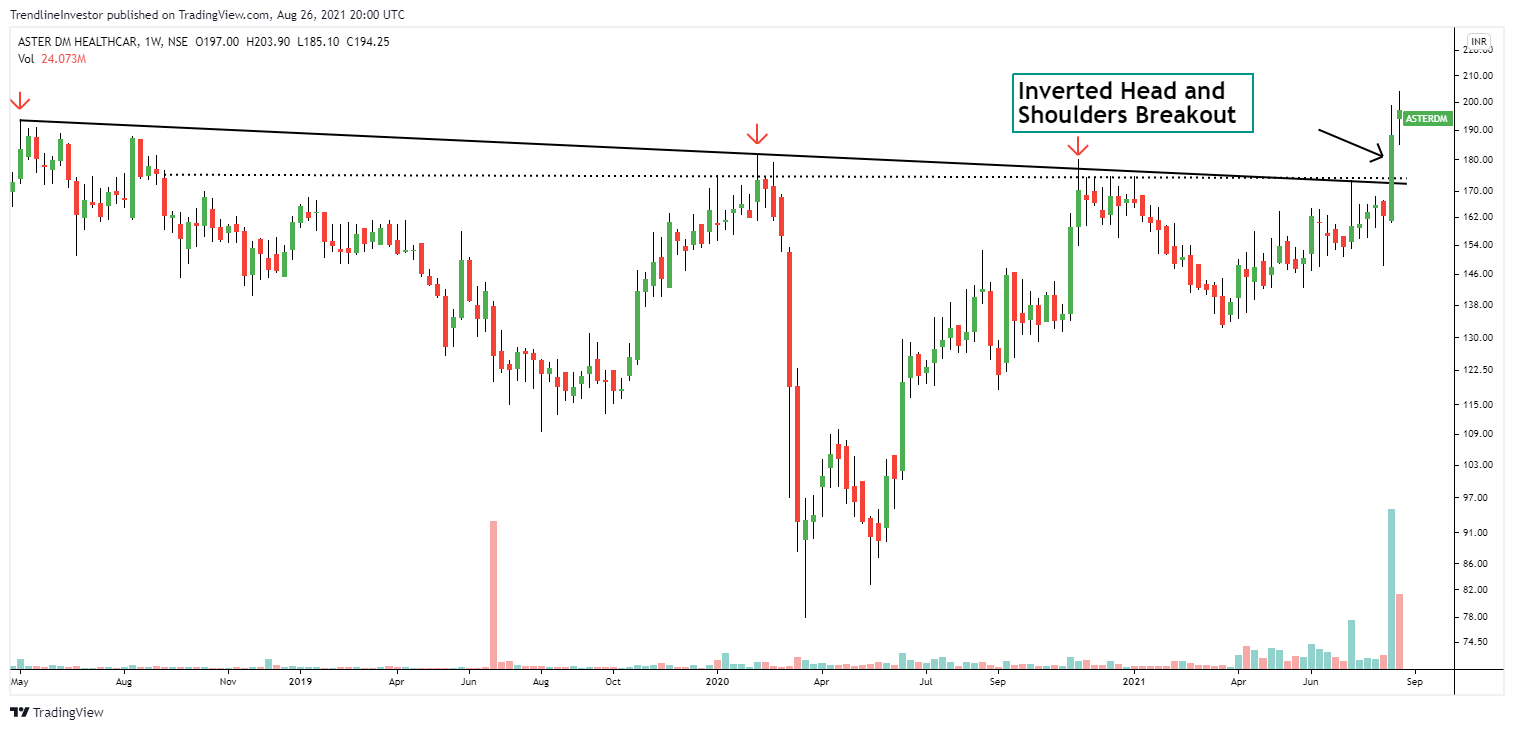
Example 3: Aster DM Healthcare
I have intentionally not drawn the pattern and would like you to identify the Head, Neckline and the Left/Right Shoulders.
Do let me know what could have been the buy price and stop loss for this stock, in the comments section.
If you liked my blog, you can support me by buying me a coffee!

One thought on “Inverted Head and Shoulders Pattern”